Smoothing the Marmousi model for Gaussian-packet migrations
This is an example how to fit the gridded velocities by a smooth
model, without interfaces, suitable for ray tracing.
The models with interfaces will require further study.
We take the gridded velocities of the "Marmousi model and dataset"
and build the smooth velocity model suitable for ray tracing.
Notes on history file '
mar-vel.h'
History file 'mar-vel.h' is not designed to be executed with data
of subdirectory 'mar' of package DATA. It requires file 'velocity.h@'
of the "Marmousi model and dataset", containing the gridded velocities.
Since file 'velocity.h@' is large, history file 'mar-vel.h' has been
used to create file 'mar-vel.dat'
used by history files 'mar-inv.h' and 'mar-test.h'.
Data and model parametrization
Velocities in the Marmousi model are discretized on the grid of
751*2301 points with spacing 4m*4m. This is too large number of data
for inversion. Since the bicubic B-splines in the model are to be
spaced much more sparsely, the set of slownesses inside a cell small
with respect to the B-spline cell act nearly like a single average
slowness.
We choose the data grid of 76*116=8816 points with spacing 40m*80m
and the B-spline grid of 16*24=384 points with spacing 200m*400m.
Notes on history file '
mar-inv.h'
Choosing the maximum Lyapunov exponent
The length of synthetic seismograms is Tmax=2.9s. This means that
the maximum sum of travel times from the source and receiver is
limited by Tmax,
For average Lyapunov exponent lambda, the maximum number of arrivals
from a source times the number of arrivals from a receiver may be
roughly approximated by
|
exp(lambda*TS) * exp(lambda*TR) .
|
(2)
|
If we choose
|
lambda .LE. 2/Tmax = 0.690 /s ,
|
(3)
|
the product of the numbers of arrivals from a source and a receiver
probably does not exceed exp(2), i.e., probably does not exceed 7.
Choosing the maximum Sobolev norm of the model
We assume in equation (51) of Klimes(1999) at least one shift of -ln2
for a source and one for a receiver. We thus approximate the Lyapunov
exponent by
|
lambda = average{sqrt[neg(V*v)]} - 2 ln2 / Tmax ,
|
(4)
|
i.e.,
|
average{sqrt(neg[V*v)]} .LE. 2 * (1+ln2) / Tmax ,
|
(5)
|
where neg(f)=(f-|f|)/2 is the negative part of f,
V is the second velocity derivative perpendicular to a ray
and v is the velocity. We make several other rough approximations,
|
average[sqrt(|V*v|)] .LE. 4 * (1+ln2) / Tmax ,
|
(6)
|
|
average[(V*v)2] .LE. [ 4 * (1+ln2) / Tmax ]4 ,
|
(7)
|
|
average[(U*v3)2] .LE. [ 4 * (1+ln2) / Tmax ]4 ,
|
(8)
|
where U is the second slowness derivative perpendicular to a ray.
|
average(U2) .LE. [ 4 * (1+ln2) / Tmax ]4
/ average(v)6 ,
|
(9)
|
|
||u||2 * 3/8 .LE. [ 4 * (1+ln2) / Tmax ]4
/ average(v)6 ,
|
(10)
|
|
||u|| .LE. sqrt(8/3) * [ 4 * (1+ln2) / Tmax ]2
/ average(v)3 ,
|
(11)
|
where ||u|| is the 2-D Sobolev norm given by file
'sob22.dat',
|
||u|| = sqrt[(u,11)2
+(u,22)2
+(2/3)u,11u,22
+(4/3)u,12)2] .
| (11a)
|
For average(v)=3000m/s, we wish the maximum Sobolev norm of the model
|
||u||max = 0.330E-9s/m3 .
|
(12)
|
Inversion and smoothing
Objective function is taken in the form of
|
y = [|u-u0|/(given slowness deviation)]2
+ (SOBMUL*||u||)2 ,
|
(13)
|
where |u-u0| is the standard slowness deviation of the model
from gridded slownesses and ||u|| is the 2-D Sobolev norm given
by file 'sob22.dat'.
We specify a unit given slowness deviation,
|
(given slowness deviation)=1s/m .
| (13a)
|
(a) First iteration:
We first perform inversion with SOBMUL=0 (i.e., without smoothing)
and obtain the standard slowness deviation of the model
|
|u-u0| = 0.290E-4 s/m
|
(14)
|
stored in file 'mar-ud1.out'. Note that the standard slowness
deviation from the densely sampled grid 4m*4m is larger, 0.340E-4s/m.
The Sobolev norm of the model smoothed just by the projection onto
the B-splines is large in comparison with (12),
|
||u|| = 3.735E-9 s/m3 ,
|
(15)
|
see file 'mar-un1.out'. The value of the objective function is
(b) Second iteration:
We choose
|
SOBMUL = |u-u0| / (given slowness deviation)
/ ||u||max ,
|
(17)
|
where we specified (given slowness deviation)=1s/m. Then
|
SOBMUL = 0.290E-4 / 0.330E-9 s/m3 = 87878 m3/s
|
(18)
|
and we enter
for the second iteration.
After the inversion, we obtain the standard slowness deviation of
|
|u-u0| = 0.408E-4 s/m
|
(20)
|
stored in file 'mar-ud1.out', and the Sobolev norm
|
||u|| = 0.134E-9 s/m3 ,
|
(21)
|
stored in file 'mar-un1.out'. The value of the objective function is
|
y = 1.66E-9 + 0.145E-9 .
|
(22)
|
(c) Third iteration:
We choose
|
SOBMUL = SOBMUL * ||u|| / ||u||max ,
|
(23)
|
i.e.,
|
SOBMUL = 90000 m3/s * 0.1336E-9 s/m3 / 0.330E-9 s/m3 ,
|
(24)
|
which is approximately
|
SOBMUL = 36000 m3/s .
|
(25)
|
After the inversion, we obtain the standard slowness deviation of
|
|u-u0| = 0.377E-4 s/m
|
(26)
|
stored in file 'mar-ud1.out', and the Sobolev norm
|
||u|| = 0.328E-9 s/m3 ,
|
(27)
|
stored in file 'mar-un1.out'. The value of the objective function is
|
y = 1.42E-9 + 0.139E-9 .
|
(28)
|
(d) Subsequent iterations:
The iterations may be repeated until we arrive at the desired value
of ||u||. Then, we may repeat the inversion with sparser or denser
B-spline grid. If the B-spline grid is sufficiently dense, a denser
B-spline grid does not influence the resulting model. If the resulting model
does not change with a sparser grid, we may switch to the sparser
B-spline grid. We performed the following tests of the B-spline grid density:
| B-spline grid
| 200m*400m | 250m*400m | 300m*400m | 375m*400m
|
| |u-u0| / (s/m)
| 0.376725E-04 | 0.377243E-04 | 0.379596E-04 | 0.384356E-04
|
| ||u|| / (s/m3)
| 0.328061E-09 | 0.325954E-09 | 0.316512E-09 | 0.296923E-09
|
| B-spline grid
| 200m*400m | 200m*460m | 200m*511m | 200m*575m
|
| |u-u0| / (s/m)
| 0.376725E-04 | 0.377246E-04 | 0.377508E-04 | 0.378320E-04
|
| ||u|| / (s/m3)
| 0.328061E-09 | 0.326122E-09 | 0.325090E-09 | 0.322291E-09
|
We might use a B-spline grid up to 1.25 times sparser in both directions than
200m*400m. Coarser grids than 250m*500m are smoothed by insufficiently
sampled splines. Since the spline smoothing is much worse than
smoothing with the Sobolev scalar products, we should avoid sparser
B-spline grids than 250m*500m for the smoothed Marmousi model.
We stop the iterations, rename the resulting model 'mar-mod.out'
to 'mar-mod.dat'
and proceed to more detailed tests of the smoothed model.
Notes on history file '
mar-test.h'
Statistical properties of the model
We discretize the velocity and its first and second derivatives
in the smoothed model
'mar-mod.dat'.
To test the code, we calculate
the standard slowness deviation once more from the gridded velocity
and obtain the value of
|
|u-u0|grid 40*80 = 0.377E-4 s/m
|
(29)
|
stored in file 'mar-ud2.out'. Similarly, we calculate the Sobolev
norm of the slowness from the gridded velocity and its derivatives
and obtain the value of
|
||u||grid 40*80 = 0.330E-9 s/m3 ,
|
(30)
|
stored in file 'mar-un2.out'. Note that for denser grid 8m*16m we
obtain
|
|u-u0|grid 8*16 = 0.413E-4 s/m
|
(31)
|
and
|
||u||grid 8*16 = 0.328E-9 s/m3 .
|
(32)
|
The difference between ||u||grid 8*16 and the value of stored
||u|| in file 'mar-un1.out' is 0.0001E-9 s/m3. For original dense
grid 4m*4m we have
|
|u-u0|grid 4*4 = 0.418E-4 s/m .
|
(33)
|
The standard relative slowness deviation, which equals the standard
relative travel-time deviation for very short rays, is
|
|u/u0-1|grid 40*80 = 0.130 ,
|
(34)
|
see file 'mar-ur2.out', and
|
|u/u0-1|grid 4*4 = 0.145 .
|
(35)
|
We may also plot gridded slowness 'mar-u0.ps' having been fit, and
slowness 'mar-u.ps' in the smoothed model.
Average Lyapunov exponent for the model
Average Lyapunov exponent for the 2-D model, calculated by program
'modle2d.for',
has the value of
and is stored in file 'mar-lem.out' in the form of line in order to
be plotted by program
'pictures.for'
into the graph of the angular
dependence of the directional Lyapunov exponents 'mar-led.out',
see figure 'mar-le.ps'. The frame of the figure is stored in file
'mar-lef.out'. The Lyapunov exponent is averaged over the angles
with a uniform weight, in accordance with the isotropic Sobolev
scalar products used for smoothing. Although the Lyapunov exponent
is little bit better than we formerly required, it is not as small
as to decrease the smoothness of the model without testing ray
tracing and the widths of Gaussian beams in the model.
The product of the numbers of arrivals from a source and a receiver
thus probably does not exceed exp(.519*2.9)=exp(1.5), i.e., probably
does not exceed 5.
Ray tracing and widths of Gaussian beams
The source and receiver points in the Marmousi data set
are equally spaced with the interval of 25m.
The leftmost point at x2=425m
corresponds to receiver 1 of shot 1.
The rightmost point at x2=8975m
corresponds to shot 240.
There are thus 343 different source and receiver points
from 425m to 8975m. We index them by integers from 1 to 343.
File 'mar-srp.dat'
contains position
of formal point 0 and the interval vector between the points.
Program 'srp.for'
may be used
to generate positions of points 1 to 343.
Ray tracing and the calculation of the gridded numbers of arrivals
and the widths of Gaussian beams for a specified source point
is performed by history file
'mar-crt.h'.
We selected 18 source positions
1, 20, 40, 60, 80, 100, 120, 140, 160, 180,
200, 220, 240, 260, 280, 300, 320, 335.
The results for all specified individual sources are accumulated in common
grid files (data cubes).
The calculation of rays and travel times is terminated at
the travel time of 2.3s. For greater travel times from a source
or a receiver, the sum of both travel times would exceed the maximum
travel time of 2.9s for the measurement configuration under consideration.
The numbers of arrivals are small and the travel-time triplications
occur only at the ends of rays terminated at travel time 2.3s.
The numbers of arrivals are thus fine for calculations,
as we expected from the mean Lyapunov exponent for the model.
Eighteen rows in the figure below (3.5kB)
correspond to source positions
1, 20, 40, 60, 80, 100, 120, 140, 160, 180,
200, 220, 240, 260, 280, 300, 320, 335.
Travel times up to 2.3s are calculated.
Areas with no travel times are grey.
Areas with 1 arrival are yellow,
areas with 3 arrivals are green.

We now calculate the standard halfwidths of Gaussian beams
to check the suitability of the model for Gaussian-beam and
Gaussian-packet calculations.
Standard halfwidth S of Gaussian beam of crossection
multiplied by the square root of omega=2*pi*f, is interpolated
between rays and displayed in colours,
|
W = S * sqrt(2*pi*f) .
|
(38)
|
The yellow colour corresponds to Wyellow=0km/s0.5,
the green colour to
|
Wgreen= 3000 m/s0.5 .
|
(39)
|
Trapezoidal frequency filter applied to seismograms is determined
by frequencies 0Hz, 10Hz, 35Hz and 55Hz.
Gaussian beam halfwidth corresponding to the green colour is at lower
corner frequency of 10Hz
|
Sgreen = 378 m ,
Scyan = 756 m ;
|
(40)
|
at central frequency of 25 Hz
|
Sgreen = 239 m ,
Scyan = 478 m ;
|
(41)
|
and at the upper corner frequency of 35 Hz
|
Sgreen = 202 m ,
Scyan = 404 m .
|
(42)
|
Since the halfwidth should be smaller than the B-spline intervals,
acceptable halfwidth are between yellow and green. The values
between the cyan and red are awfully bad (2 to 5 times greater
values than for the green).
Three columns in the figure below (331kB)
correspond to three different initial conditions
for Gaussian beams, constant along the surface of the model.
Eighteen rows correspond to source positions
1, 20, 40, 60, 80, 100, 120, 140, 160, 180,
200, 220, 240, 260, 280, 300, 320, 335.
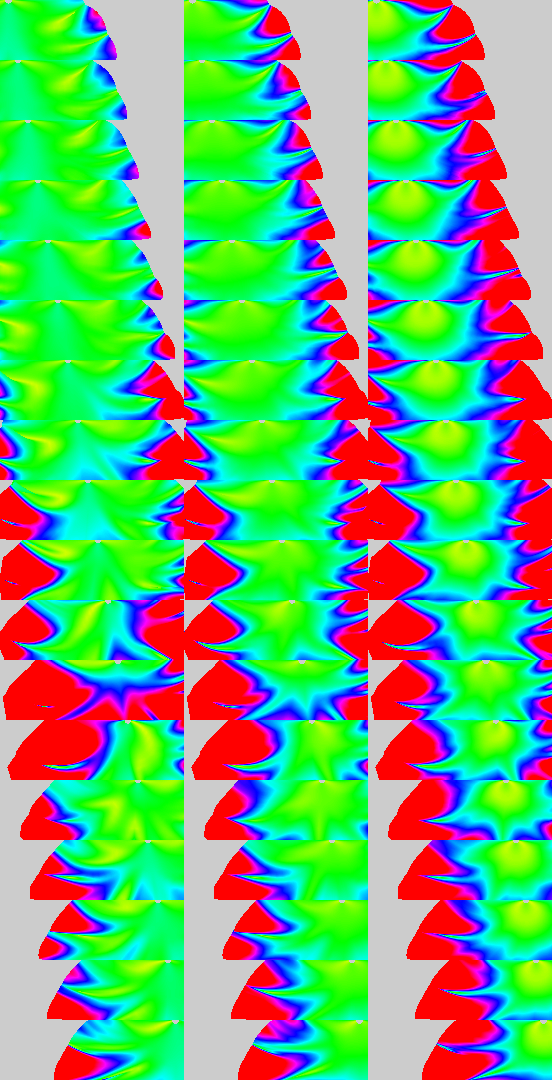
Unlike all previous tests, the standard halfwidths of Gaussian beams
indicate that the model is at the edge of applicability
of Gaussian beams and Gaussian packets, because of too small
frequencies for the high-frequency asymptotic methods.
We also see that the initial conditions for the Gaussian beams
should not be constant along the model surface and should be
carefully optimized. Until doing that, we cannot be sure whether
the smoothed model is sufficiently smooth or must be smoothed more.
References